This post first appeared on Risk Management Magazine. Read the original article.

In order to drive operational effectiveness and capital deployment efficiency, leaders of captive insurance companies are increasingly in need of improved methods for performance evaluation and tools that go beyond simple financial ratio analysis or industry benchmarking comparisons. This need includes validation of the risk management program relative to the captive’s purpose, strategy and goals, as well as transaction and decision process transparency, performance tracking, formal decision-support analytics, and informed disclosure to oversight groups.
For many organizations, captives offer considerable strategic and financial value; consequently, they play an increasingly significant role in the overall risk management program. Additionally, captives often comprise an integral element of an organization’s strategic planning efforts.
Captive growth and business strategies can be more fully supported by an enhanced ability to monitor, analyze and track performance relative to the captive’s existing risk portfolio and new coverage opportunities. The benefits of these measures can include improved risk transfer and control decisions, as well as validation of risk and insurance management practices, activities and decisions.
By improving decision-support information, the leader of an organization’s captive may gain increased recognition and commitment from senior management, which in turn leads to greater ability to write new coverages and enhance the existing program. The following method for improving decision processes for a captive offers a new approach for measuring its current performance and evaluating its potential.
Strategic Captive Opportunity and Utilization Technique
The strategic captive opportunity and utilization technique (SCOUT) is a performance evaluation methodology that consists of a performance scorecard and a reporting dashboard. It provides a framework to evaluate, rank and prioritize current and potential business/risk opportunities, and a foundation for improving decision-making and enhancing strategic utilization and planning.
The scorecard is a database that captures strategic and tactical factors while the dashboard consolidates the scorecard data for monitoring, analysis and reporting. Together, these tools support decision-making capabilities.
As a technique for measuring captive opportunity and utilization, SCOUT conveys meaningful information with simplicity, converts qualitative benefits into quantitative terms, and delivers a formal process that is consistent and reusable. The SCOUT process involves evaluating the performance of each coverage underwritten by the captive, as it relates to the original purpose, strategy and goals for captive formation. It also provides a framework for assessing the potential success of proposed coverages, including pro forma financial analysis, volatility considerations and risk profile changes.
Performance Scorecard
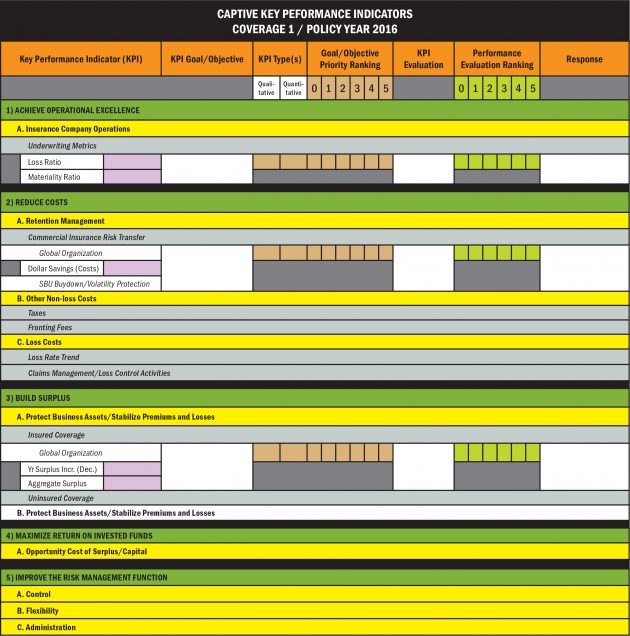
The scorecard represents a model to evaluate quantitative and qualitative metrics through a consistent scoring methodology (see below). The metrics, or key performance indicators (KPIs), include strategic goals, operational objectives and expected economic benefits.
Specifically, the model assesses five primary KPIs: 1) achieve operational excellence; 2) reduce costs; 3) build surplus; 4) maximize return on invested funds; and 5) improve the risk management function. Each KPI is broken down into critical components to fully capture economic and non-economic performance evaluation criteria. Accordingly, the KPI structure builds from strategic performance goals to detail-oriented tactical objectives.
The KPIs provide a framework for monitoring the effectiveness of the organization’s captive strategies, including identifying gaps between actual and targeted performance, as well as assessing overall organizational effectiveness and operational efficiency. KPIs can also help track progress toward a desired outcome.
Specific KPIs are selected based on their ability to determine if a strategy is working, gauge performance changes over time, and focus management’s attention on what matters most to success. The KPIs also allow measurement of accomplishments, provide a common language for communication, help reduce intangible uncertainty, and can be validated and verified.
Using the SCOUT process, each coverage underwritten by the captive is analyzed separately using selected KPIs. Input data is obtained through annual financial statements, actuarial analysis, and internal and external captive and coverage specialists.
Each KPI component is rated based on the priority of the goal or objective (mapped on the x axis) and performance evaluation of the goal or objective (y axis). Ratings criteria range from a score of “1,” which represents “minimal importance/not met” relative to goal/objective priority and goal/objective performance evaluation, through “5,” which represents “critical/exceeded” for goal/objective priority and goal/objective performance evaluation.
Additionally, each KPI component can be rated as quantitative or qualitative. When a dollar figure can be used to support the performance evaluation, the KPI component is quantitative; when benefits are more intangible and difficult to quantify, then the qualitative selection ensures these benefits are included in the performance evaluation process.

Components of the Key Performance Indicators
The five KPIs are made up of critical components that offer enhanced measurement detail. For example, the components within the “achieve operational excellence” KPI include current and historical loss ratios as well as premium materiality.
Components of the “reduce costs” KPI are based on loss versus non-loss costs. Loss costs refer to lower insurance premiums achieved through the captive’s ability to change risk retentions, based on commercial insurance rates, risk tolerance and appetite, and internal strategic business financial needs. A second element of “reduce costs” is savings from claims management and loss control activities as illustrated by loss rate trends. Claims management activities include early reporting, cost containment strategy, improved legal defense and subrogation, and increased management attention. Loss control activities include engineering, cost of risk allocation and contractual risk transfer. Non-loss cost components refer to tax dynamics, fronting fees, collateral needs or third-party vendor fees.
The “build surplus” KPI represents the buildup of underwriting profit. Performance evaluation criteria are based on insured coverage versus pure balance sheet risk and whether the coverage is intended to protect business assets and/or stabilize premiums and losses or represents diversification into a profitable new business, such as extended warranties or service maintenance agreements.
“Maximize return on invested funds” is the lone KPI that measures a potentially negative result as based on the amount of investment income that can be earned on surplus within the captive versus repatriating funds back to the parent to invest in higher income-producing opportunities. Known as opportunity cost, the performance evaluation criteria are based on selection of an appropriate internal capital rate, regulatory surplus requirements, catastrophic loss potential and future coverage needs. Determination of the internal rate of return is based on the organization’s financial strength, including cash and collateral needs, earnings, borrowing capacity, and asset strength.
Finally, the “improve the risk management function” KPI includes various qualitative criteria about the captive’s ability to improve control and administration of the risk management function and the flexibility of the risk management program. Component KPI metrics that measure improved control over the risk management function include the ability to negotiate or replace fronting insurers or reinsurers, consistent application of risk management throughout the organization, cost of risk allocation support, alignment of risk appetite and risk tolerance, underwriting dynamics, and emerging risk identification.
The component KPI metrics for improved flexibility of the risk management program include coverage forms and rates, coverage requirements, and unbundled services. Component KPI metrics for improved administration of the risk management function include ability to protect reputation, governance structure and reporting, enterprise risk management application, coverage renewal automation, data warehousing, and analytical capabilities.
Reporting Dashboard
The SCOUT dashboard offers predictive capabilities using a visual tool to track trends and align activities with goals, and helps to identify when and where important adjustments should be made to the program. The visual display should allow end users to monitor what is going on at a glance by focusing on only the most important information needed to achieve objectives. Thus, managers will be able to step back from the details contained in the scorecard and identify key trends and relationships.
 The dashboard also serves as a reporting tool for senior management and board discussions and presentations while specific supporting data is contained within the performance scorecard. From a software perspective, the scorecard represents the back-end database while the dashboard represents the front-end interface and reporting. Scorecard results are designed to link to the dashboard for automatic updating.
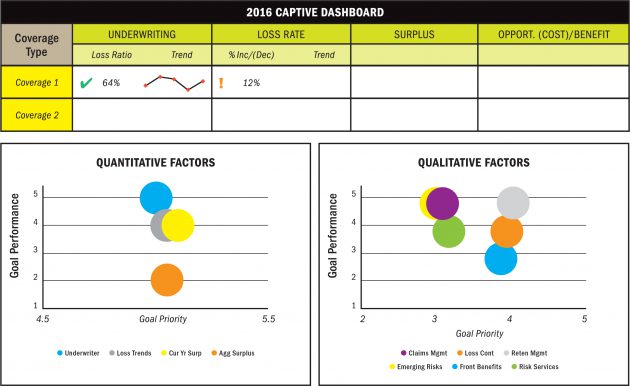
Because the dashboard is built upon information obtained in the scorecard, its final look and feel is unique to the captive’s original purpose and mission, goals and objectives. A potential dashboard application offers four design graphics, comprising: 1) select quantitative results; 2) quantitative metrics; 3) qualitative metrics; and 4) financial ratios.
As the focal point of the dashboard, the “select quantitative results” section embodies the primary analysis in the display. Figures are taken directly from the performance scorecard. Each coverage underwritten within the captive can be detailed separately and sorted by policy year. Measurements include results for underwriting, loss rate, surplus and opportunity cost KPIs. Conditional formatting can be utilized to illustrate a check, exclamation point, or X depending on performance result, in accordance with pre-defined rules. Sparkline graphics can be used to illustrate trends.
The quantitative and qualitative metrics are captured within bubble charts through rankings of goal/objective priority and goal/objective performance evaluation within the scorecard. The bubble charts represent an effective xy scatter diagram, based on the metrics used for scorecard ranking.
Finally, a financial ratios graphic can offer a traditional analysis of the financial performance of the captive as a whole. Within this analysis, actual versus benchmark ratios can be illustrated and sorted by fiscal year, including premium/reserves to surplus, risk retention to surplus, expense, loss, combined, policy year operating, investment income, asset to liability, reserves to liquid assets, and operating ratios.
Integrating SCOUT into Organizational Risk Management Culture
SCOUT offers a platform for supporting the business and growth strategies of the organization’s captive insurance company by offering a fully defined framework and methodology for consistent, sophisticated and continuous assessment of captive performance.
The next step is for the organization to integrate SCOUT into its risk management culture to help in decision-making. For this to happen, the captive leader needs to develop a formal process for updating and maintaining the scorecard and dashboard, including data extrapolation of actuarial and financial statements and input from coverage specialists and strategic business unit leaders.
When in place as a formal business process, SCOUT enables detailed and usable monitoring and tracking of risk management and risk financing functions related to a captive insurance subsidiary. It can also illustrate current and future economic benefits with both quantitative and qualitative metrics for strategic business unit leaders, board members, treasury and C-suite executives.
As a platform for making better, faster decisions, the scorecard and dashboard can fit into the organization’s enterprise risk management efforts. Information is rolled up through the dashboard function while the scorecard allows for drill-down into the specific details needed to fully support decisions. Improved management and governance can then help captives take advantage of opportunities for new coverage types, enhancements, program improvements and corrective actions.
